Why Stocks Plunged Last Week
Published Friday, February 2, 2018 at: 7:00 AM EST

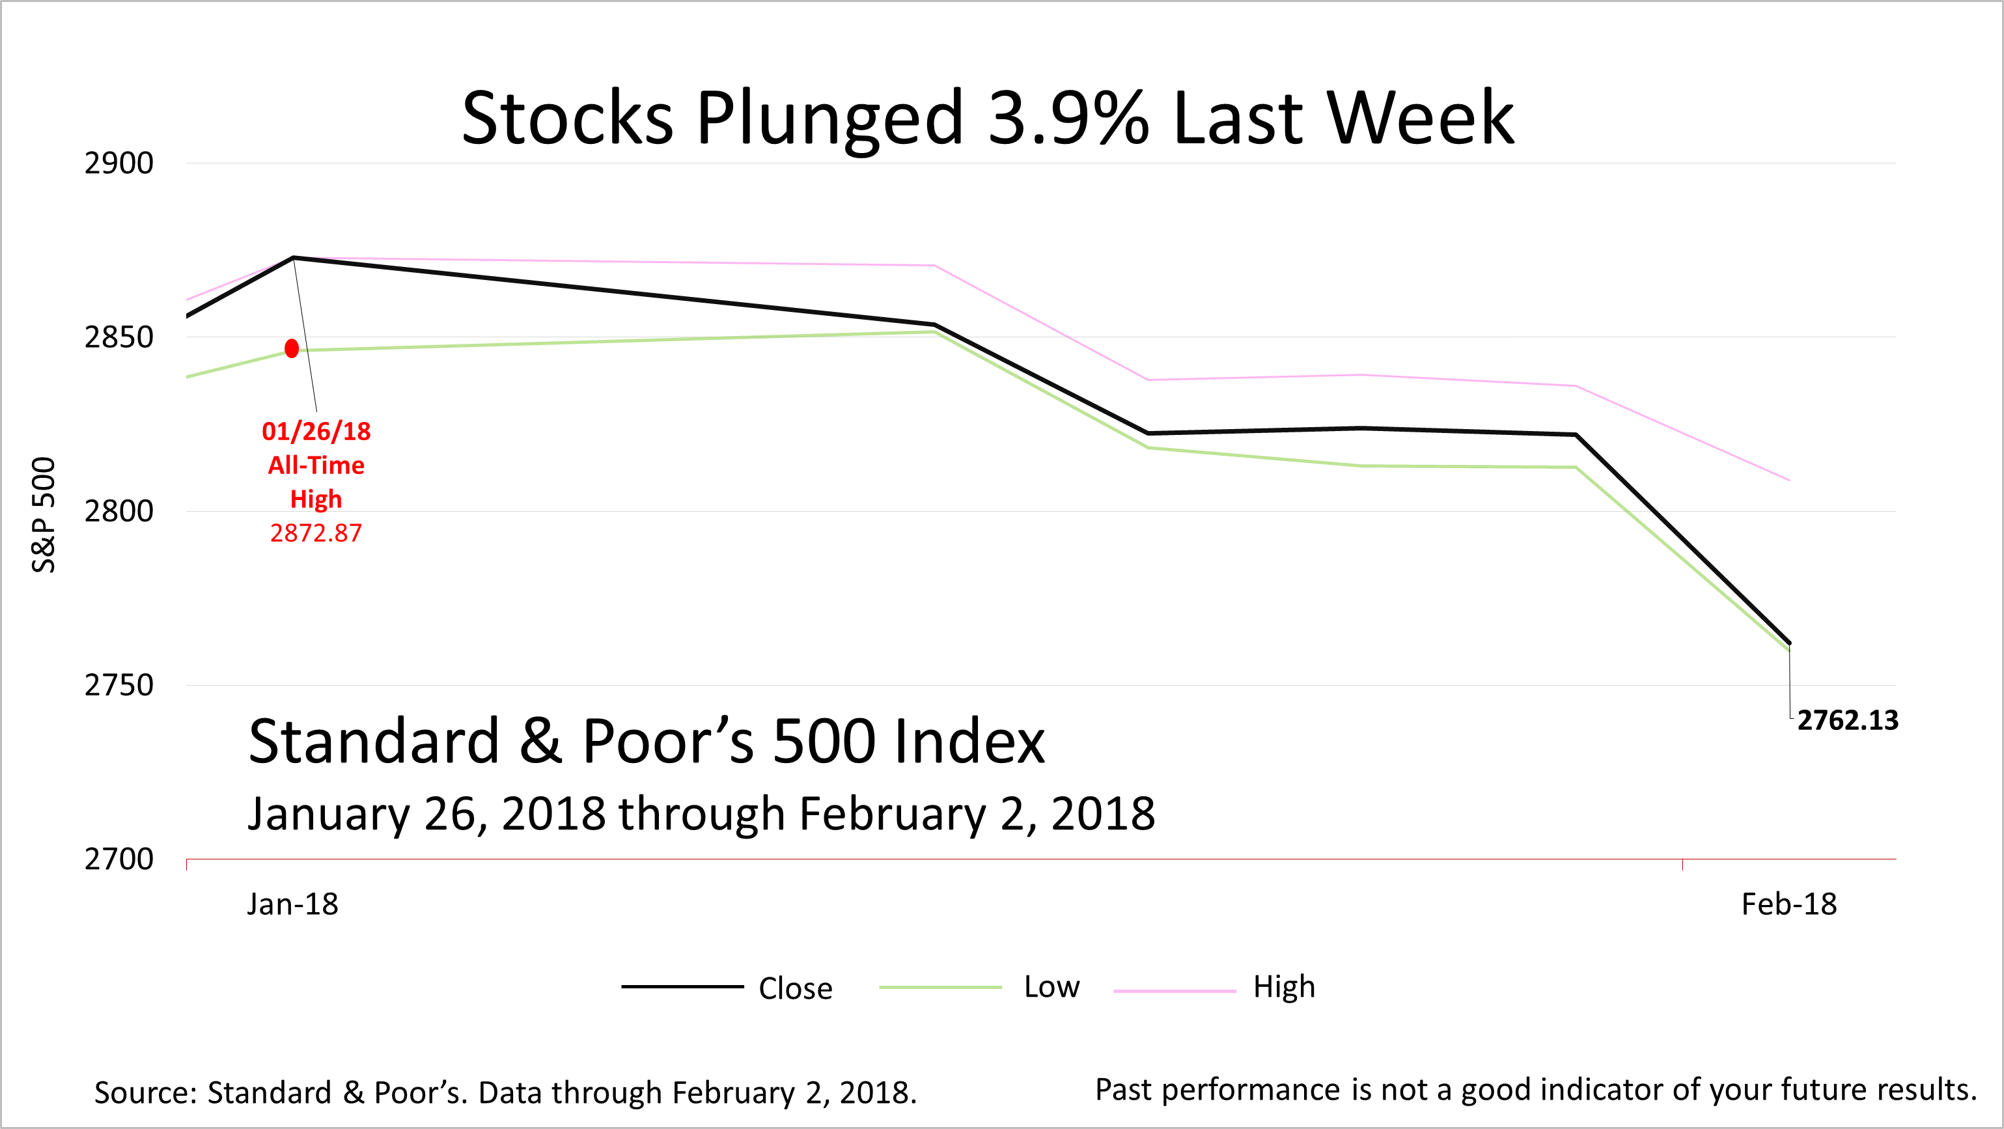
Interest rates rose on inflation fears, cratering stocks for the week. On Friday, the Standard & Poor's 500 stock index plunged by 2.1%, capping a 3.9% drop for the week, the biggest weekly loss in two years.

It was a week of big financial news: Janet Yellen exited as chair of the U.S. Federal Reserve Board of Governors, ceding control of the nation's central bank to Jerome Powell; the political crisis in Washington, D.C. deepened, adding to investor jitters; and employment costs soared while new figures on jobs and wages stoked inflation fears.
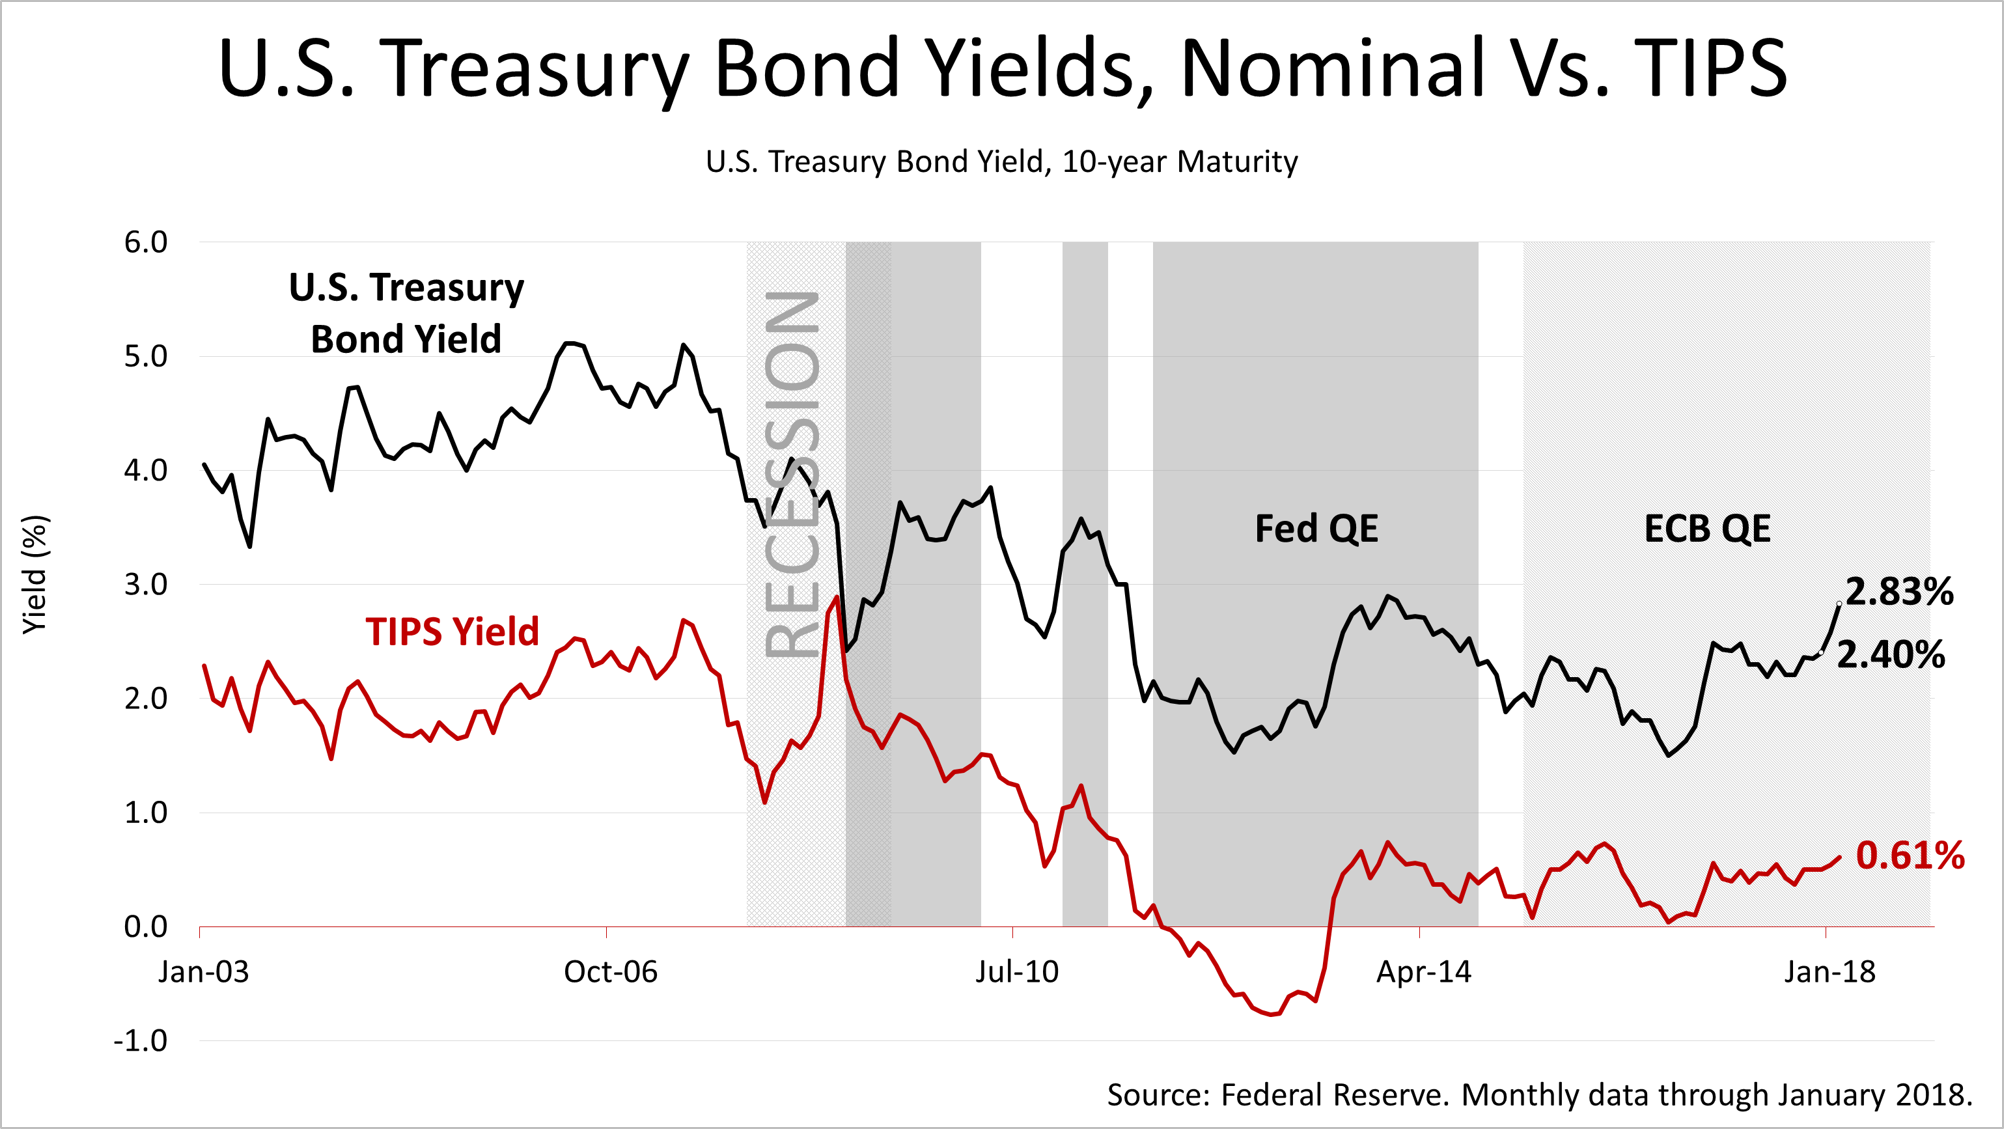
The yield on a 10-year U.S. Treasury bond rose from 2.4% to 2.8% in just the past month, according to data from the Fed. Meanwhile, in the same period, the yield on a 10-year Treasury Inflation Protected Security moved up only slightly. The difference between the nominal 10-year Treasury bond yield and the TIPS yield shows the market's expectations of rising inflation over the next 10 years.
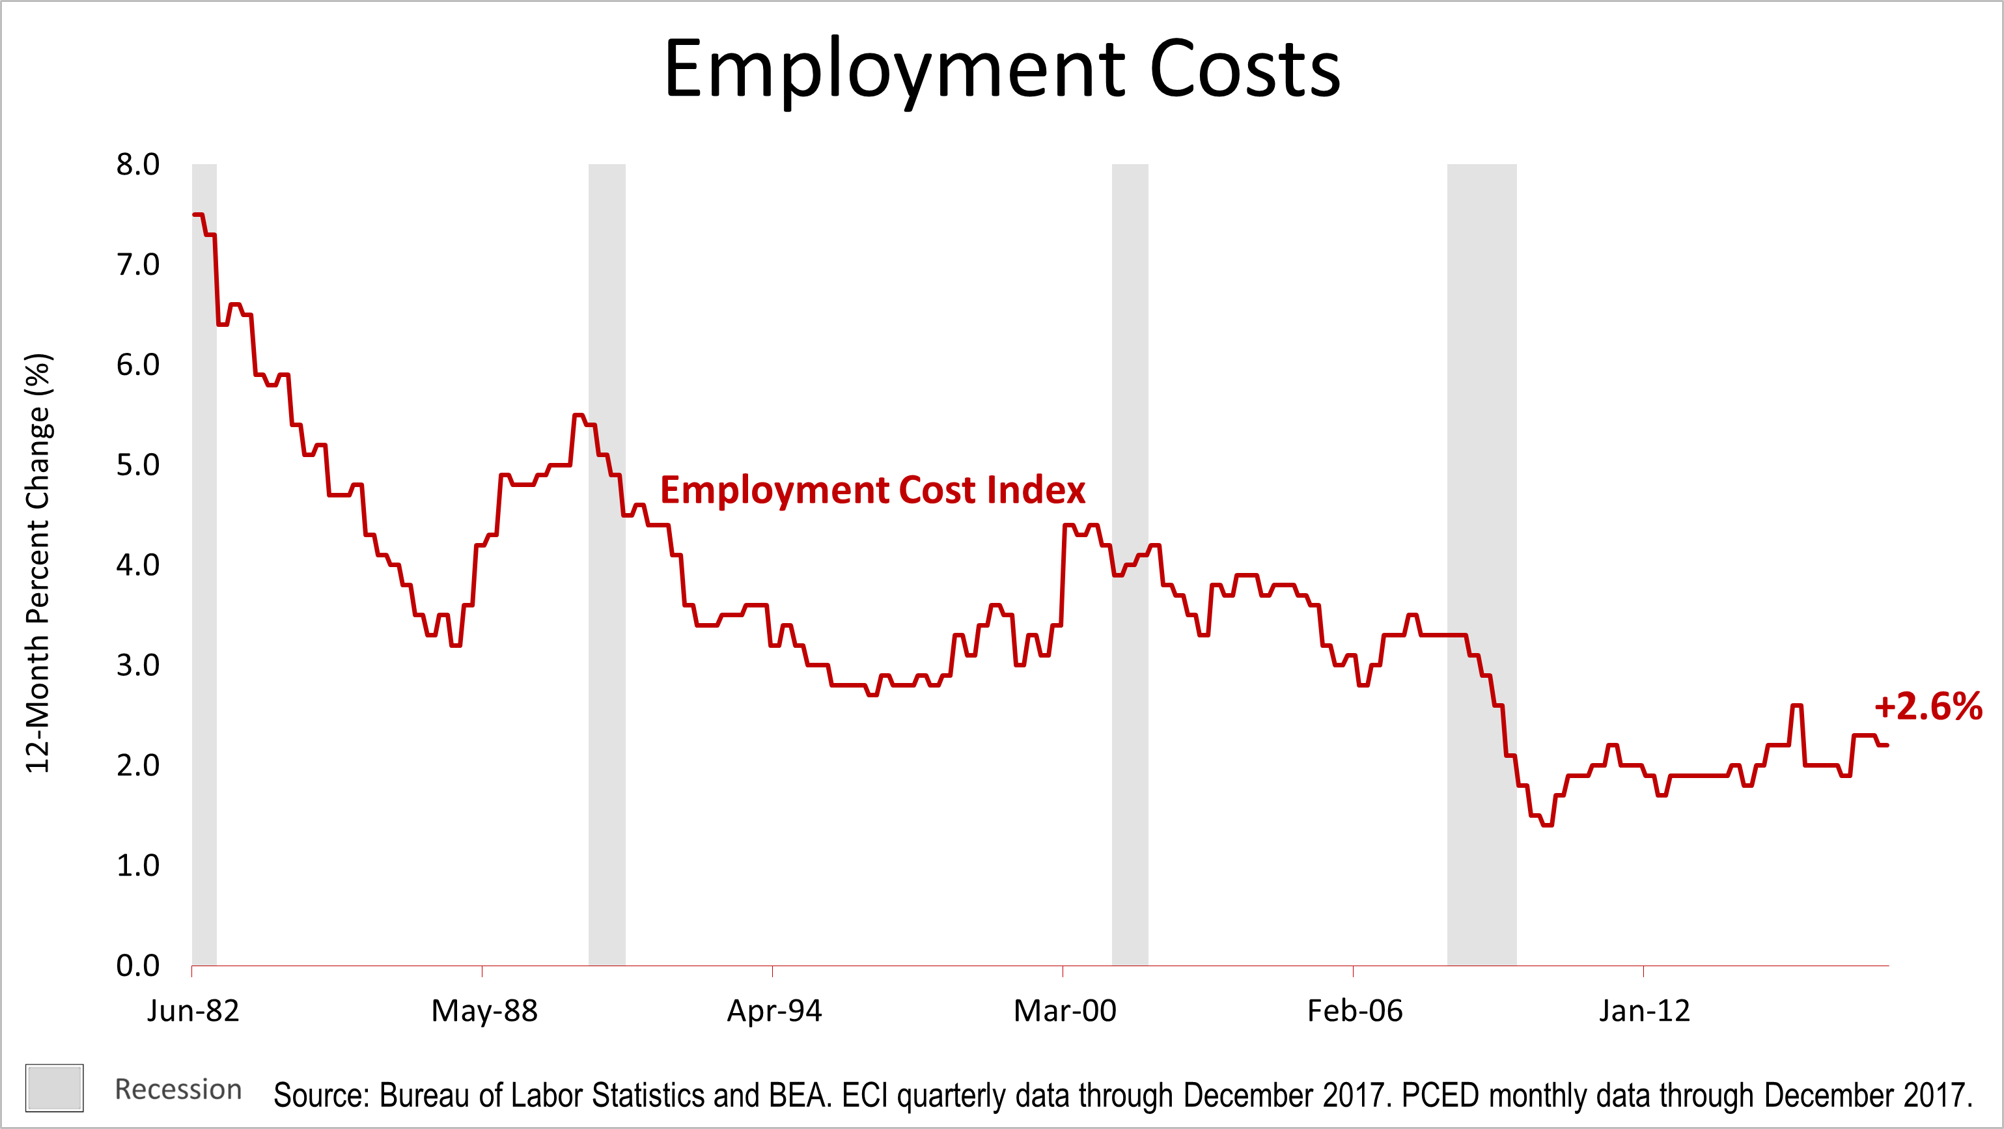
On Tuesday, the quarterly employment cost index release showed another rise, to 2.6% in the fourth quarter of 2017. That was up from 2.5% the third quarter and from 2.4% a quarter before that. Wages and benefits are rising and they are a company's biggest single cost and the biggest single inflation factor for the economy as a whole.
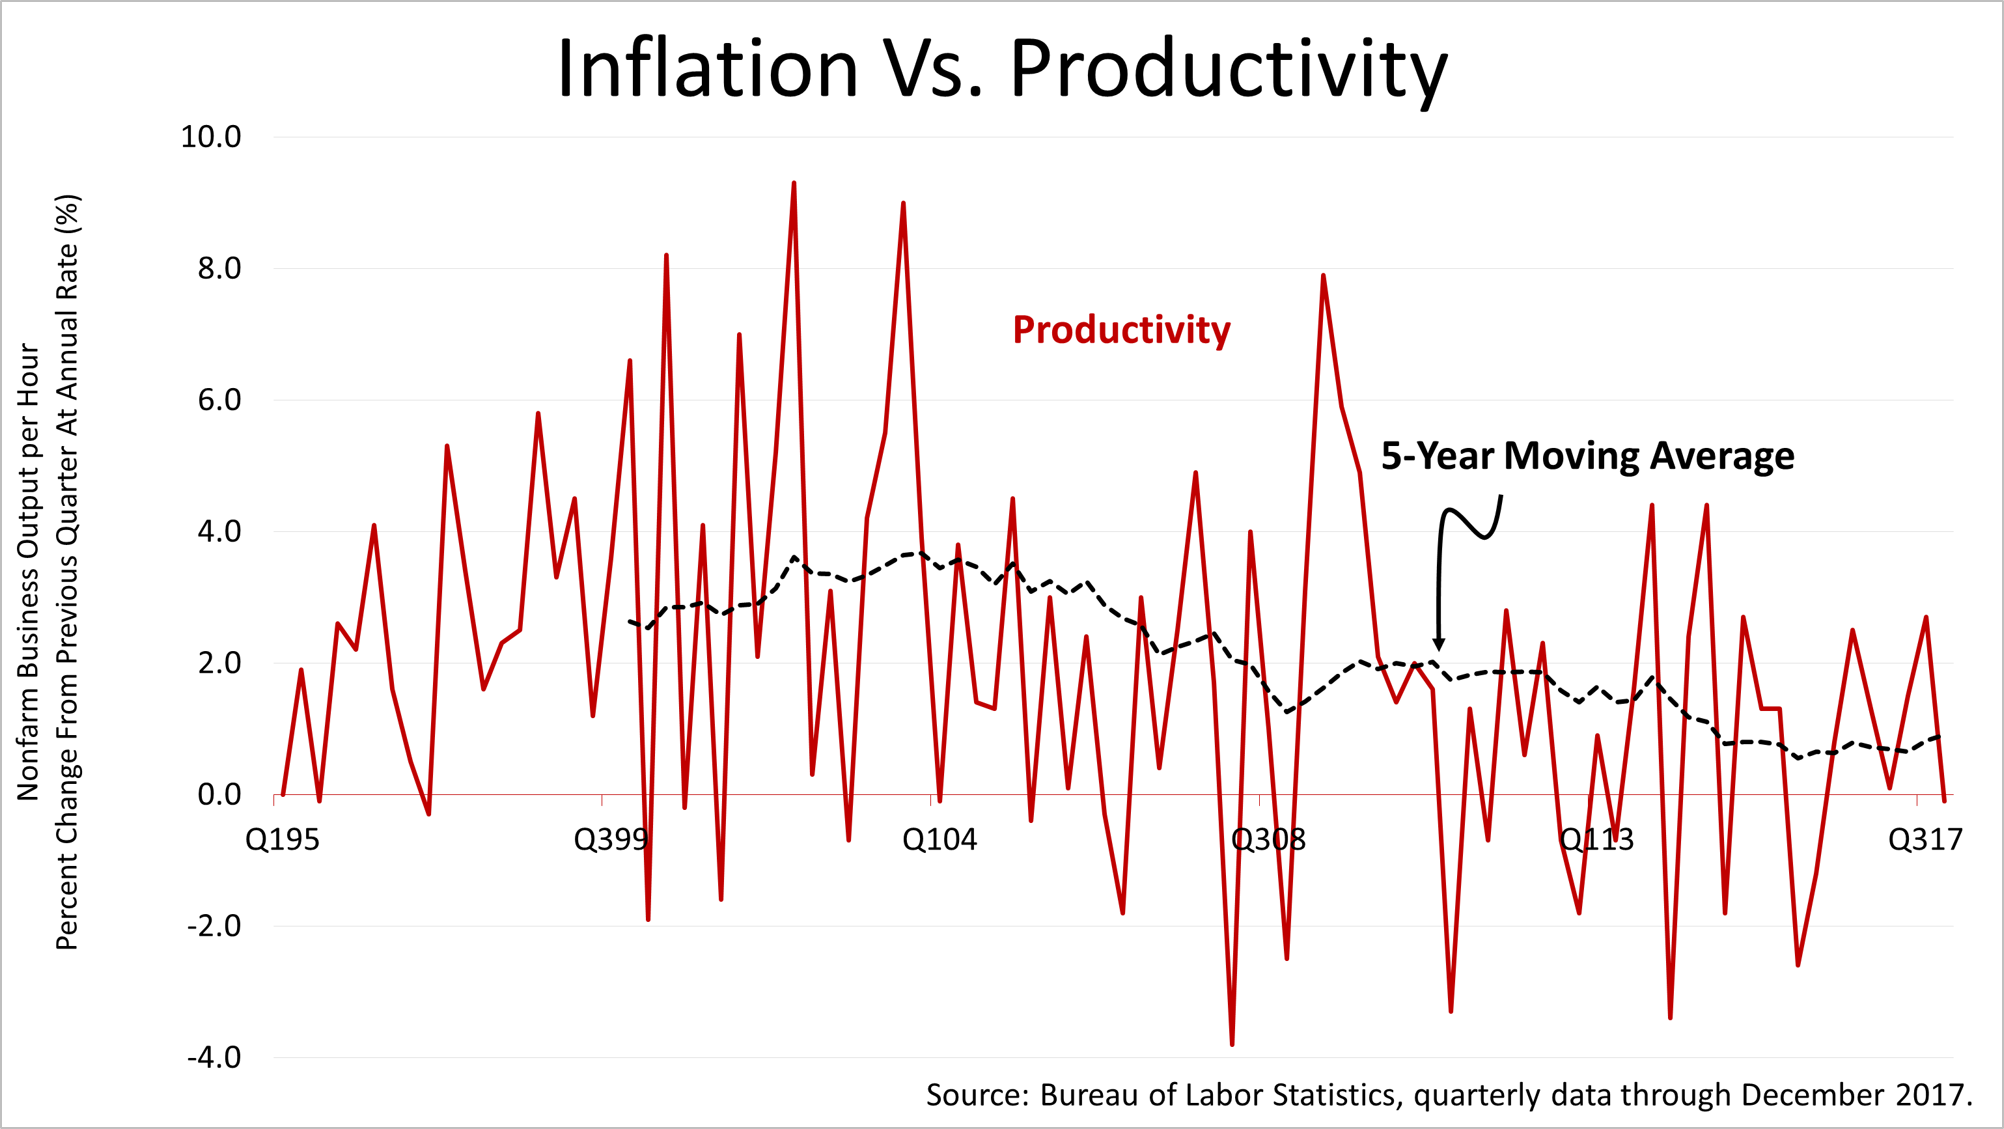
On Wednesday, the government said fourth-quarter 2017 productivity plunged from 2.7% in the third quarter to slightly negative in the final quarter of 2017. Productivity is a key factor in offsetting rising inflation, but last quarter's plunge in productivity did nothing to offset higher labor costs.
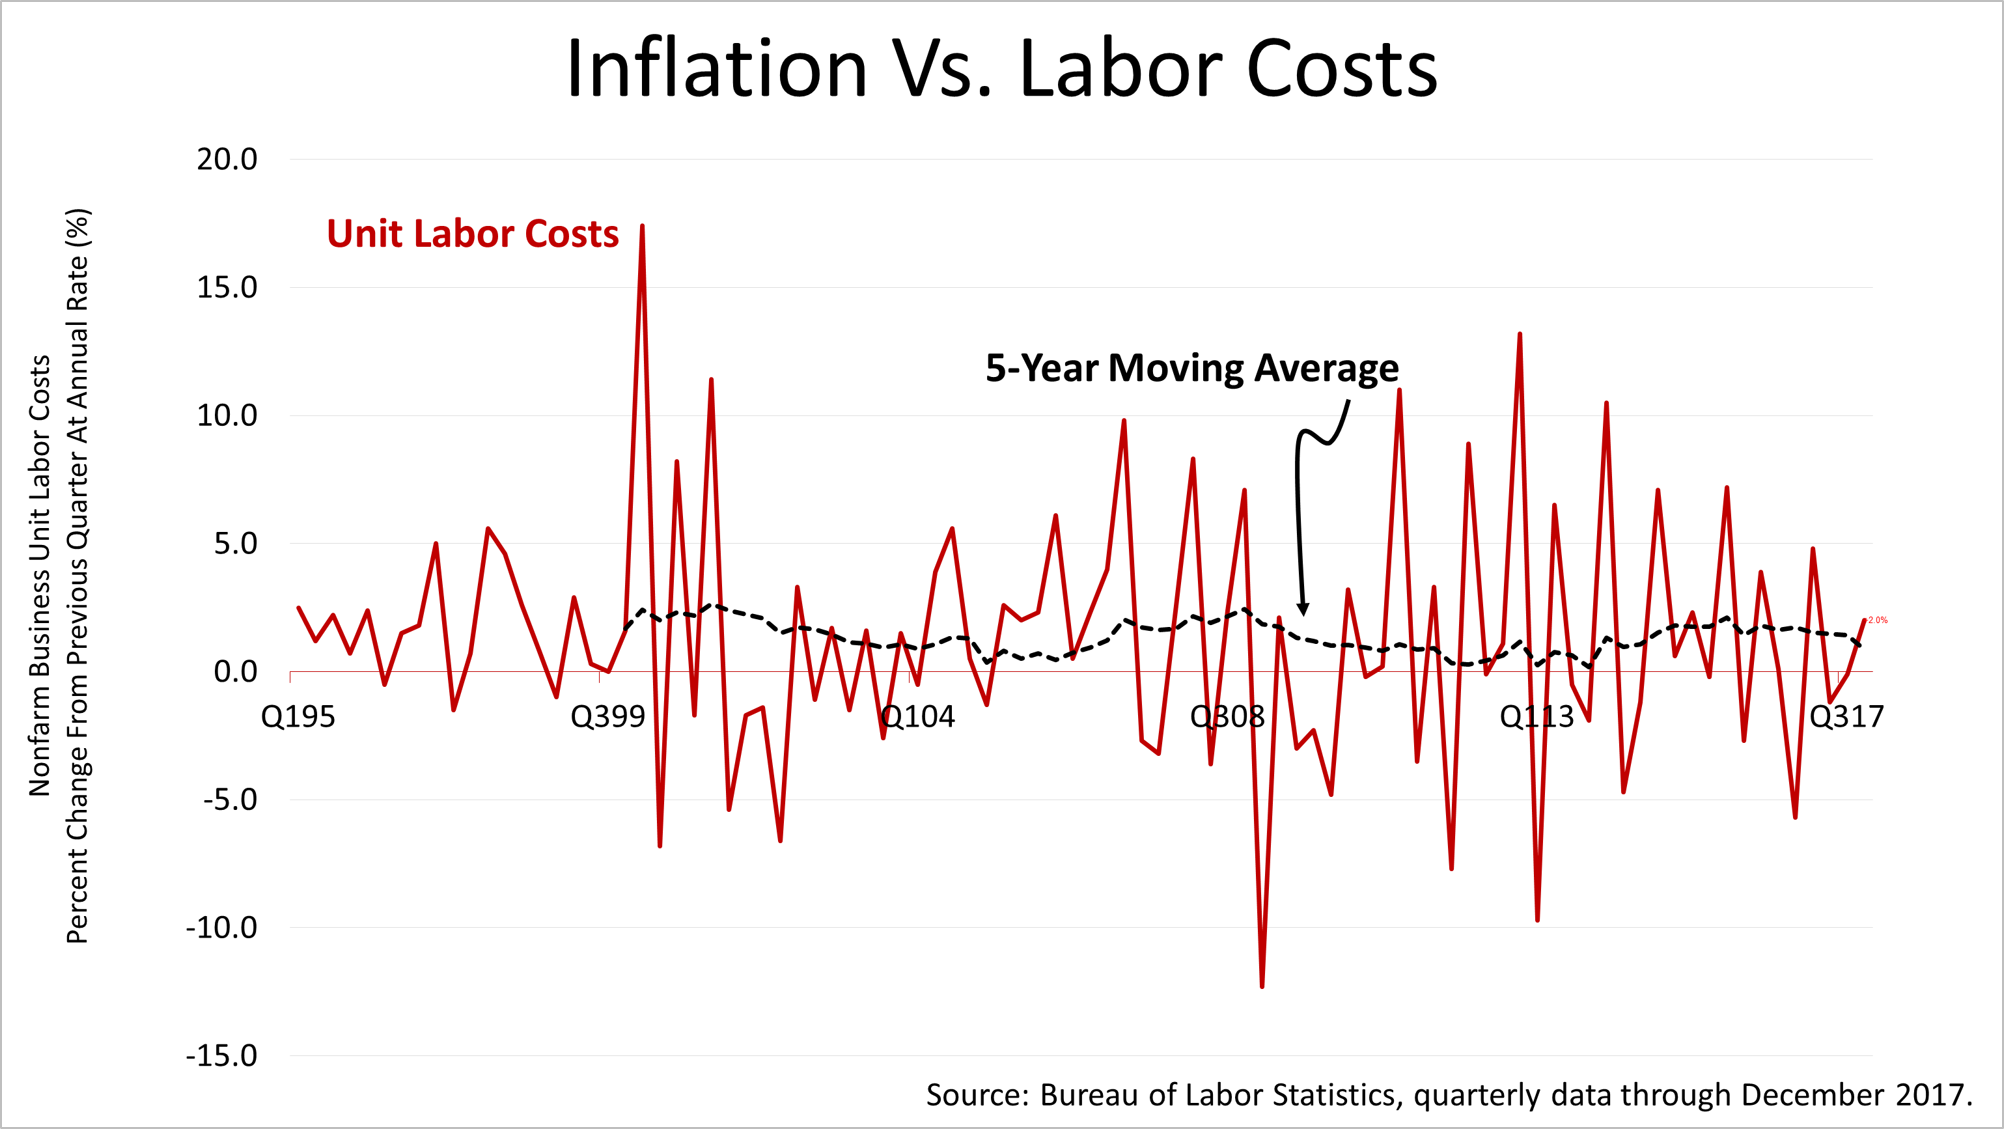
The plunge in productivity in the fourth quarter showed that wage inflation is in the pipeline. Labor costs are, by far, the biggest driver of inflation. All of this was released earlier in the week, before Friday's stock price plunge.
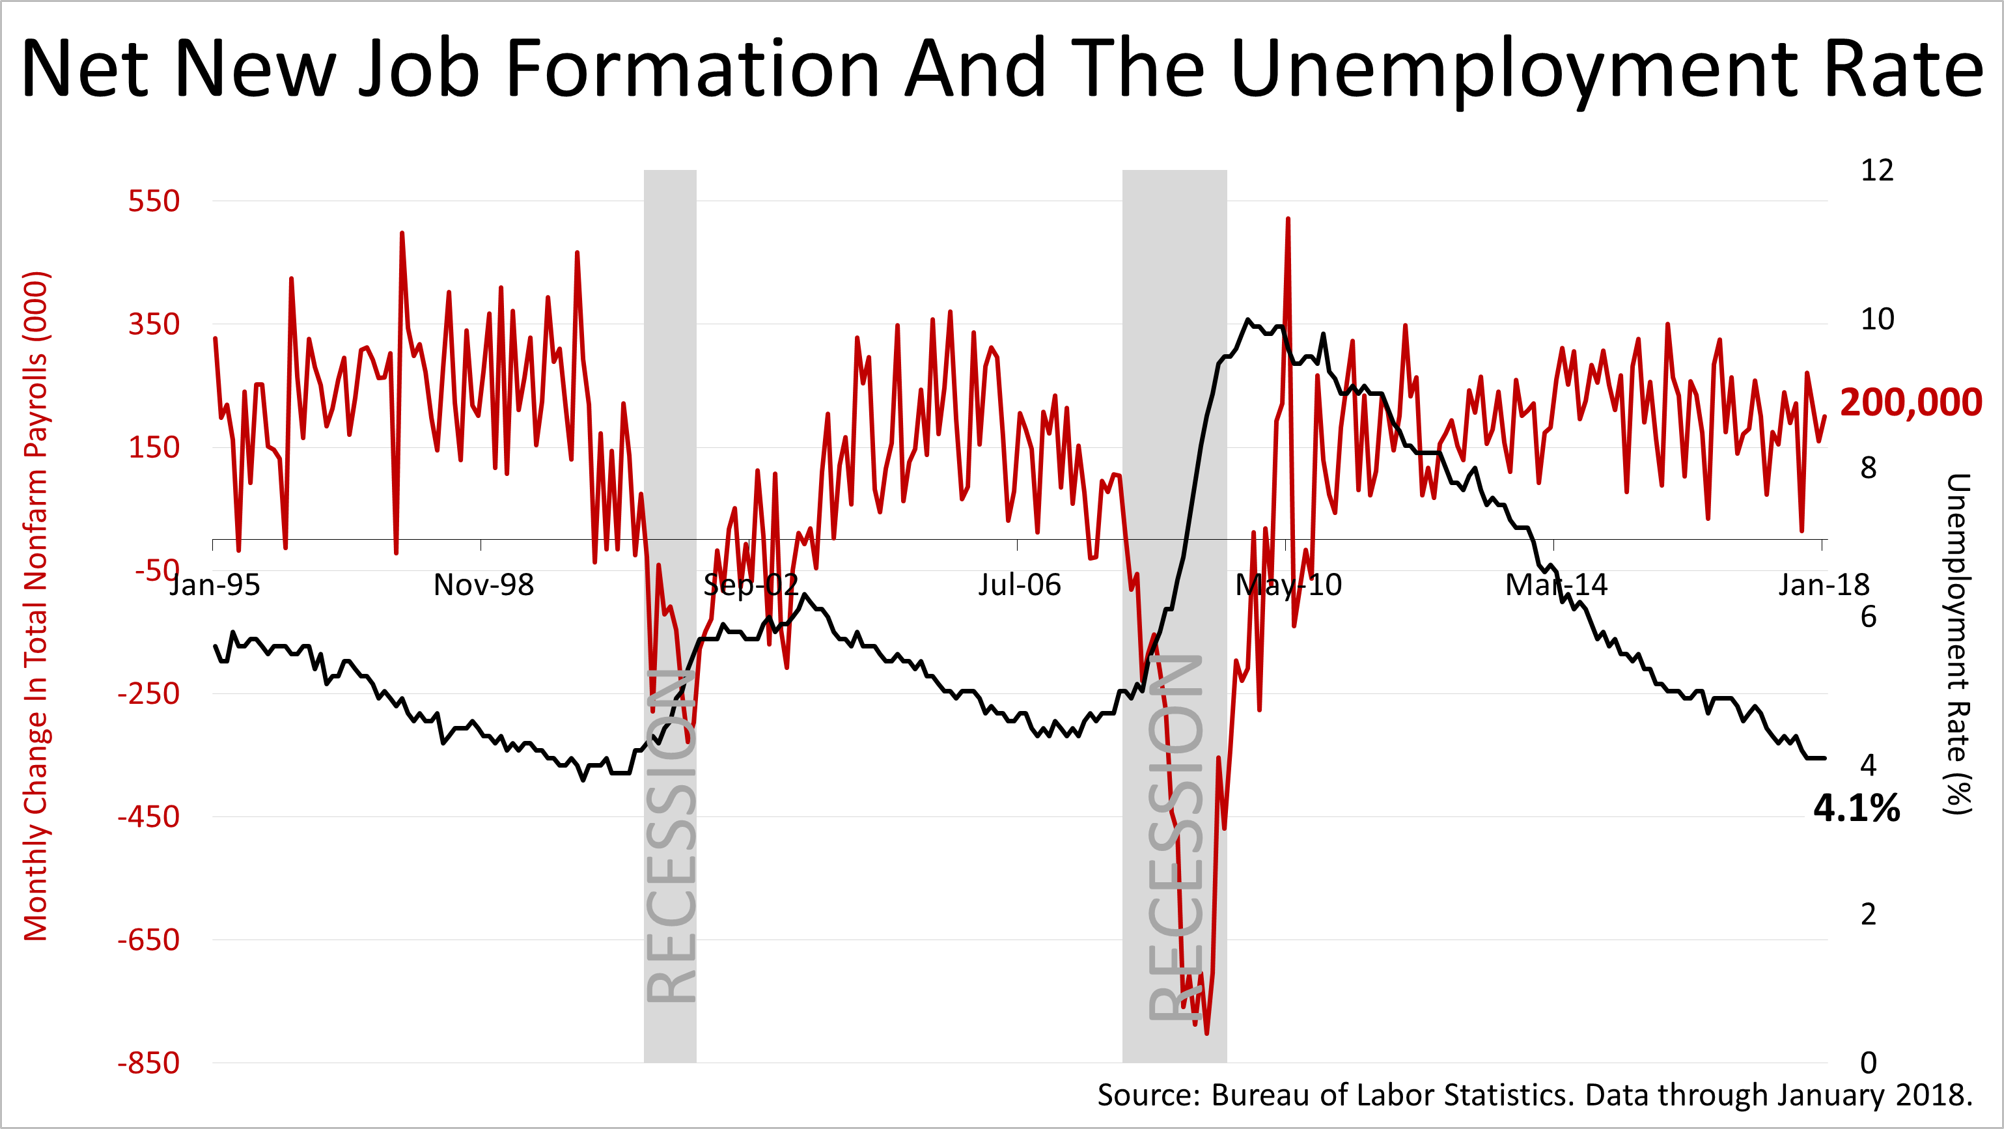
On Friday morning, the new job numbers were announced and were stronger than expected, and the unemployment rate stayed at a low last reached 18 years ago. This showed the labor market was tightening and fed into fears of higher inflation.
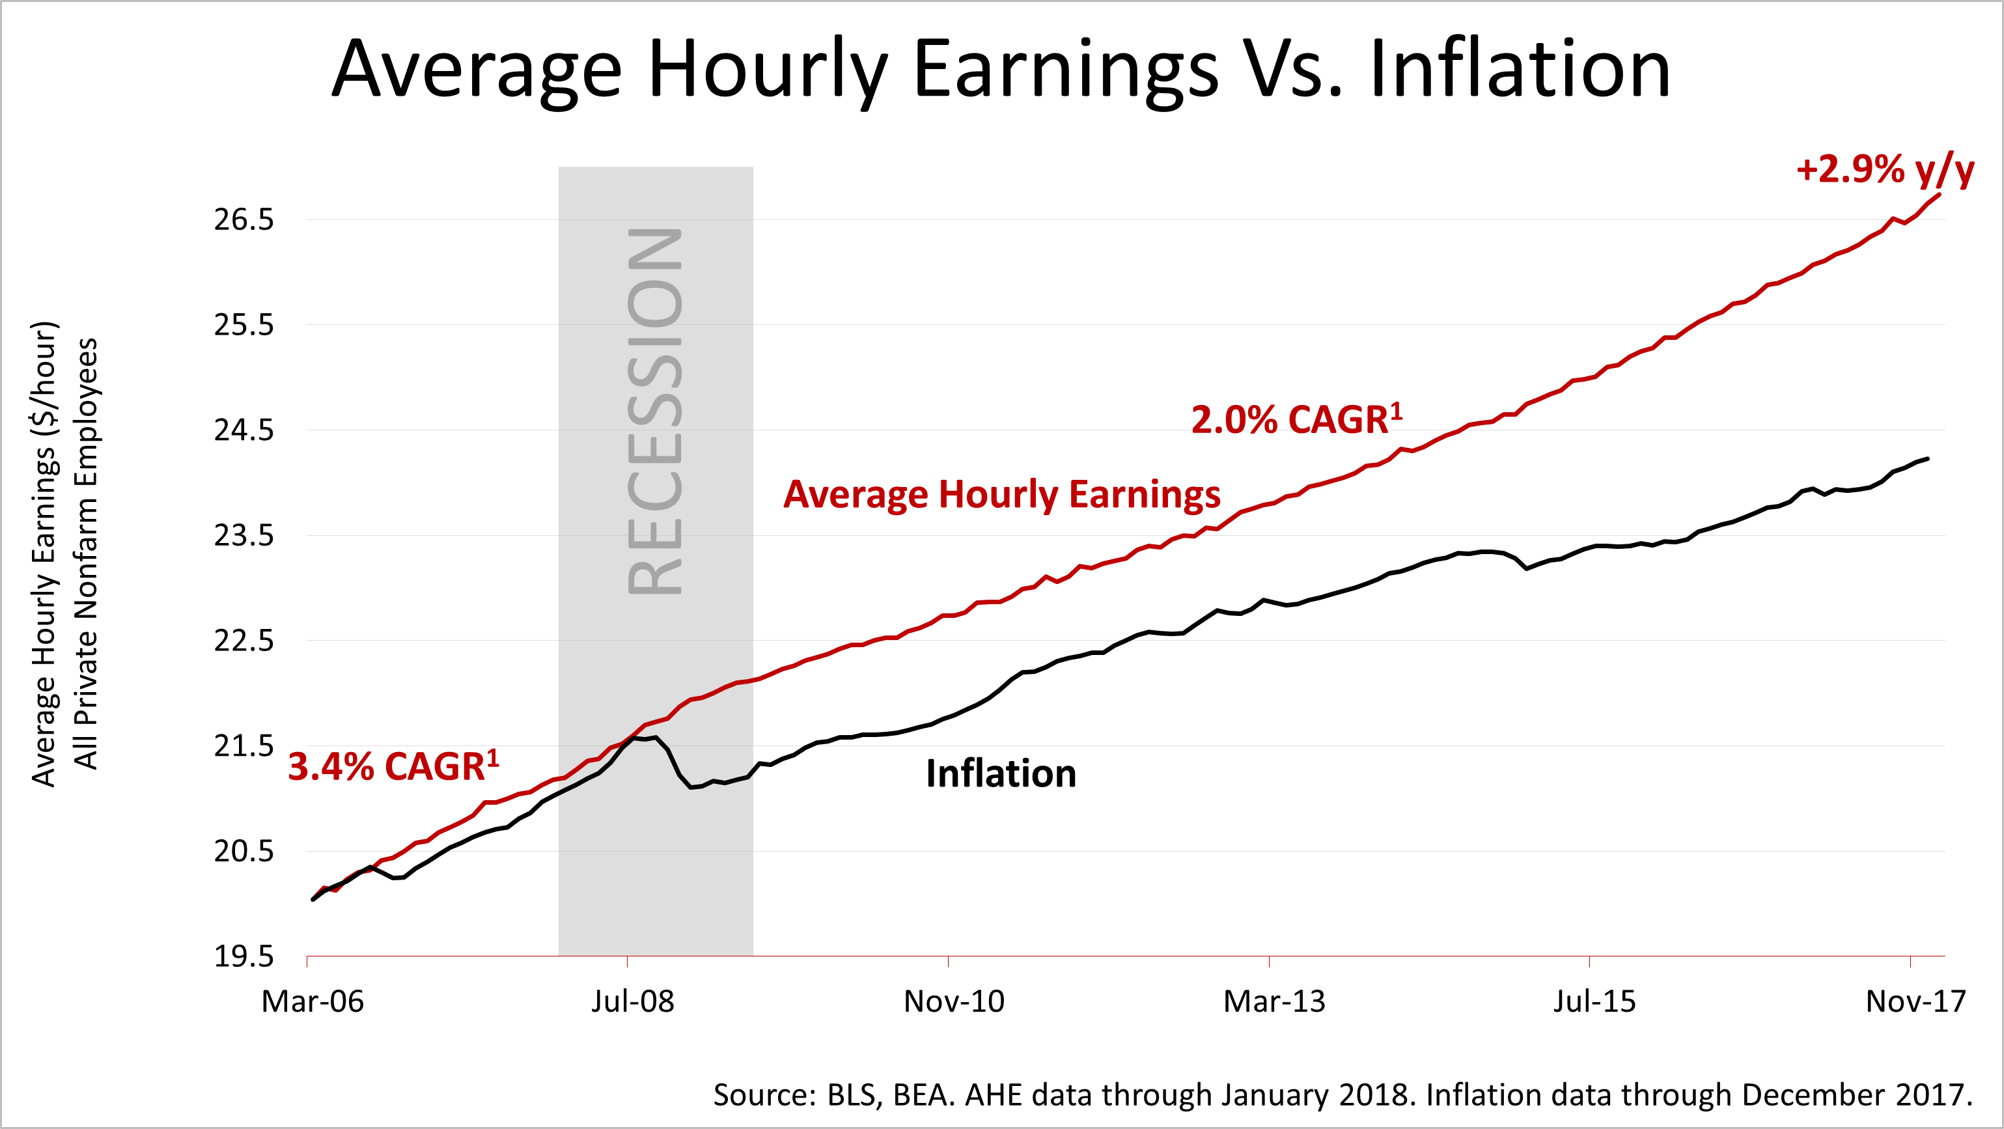
Also on Friday morning, new figures on wages were reported and average hourly earnings continued to accelerate. In the 12 months of 2017, average hourly earnings rose by 2.9%. That's almost a 50% faster annual growth rate than was averaged annually since the start of the economic expansion in mid-2009.
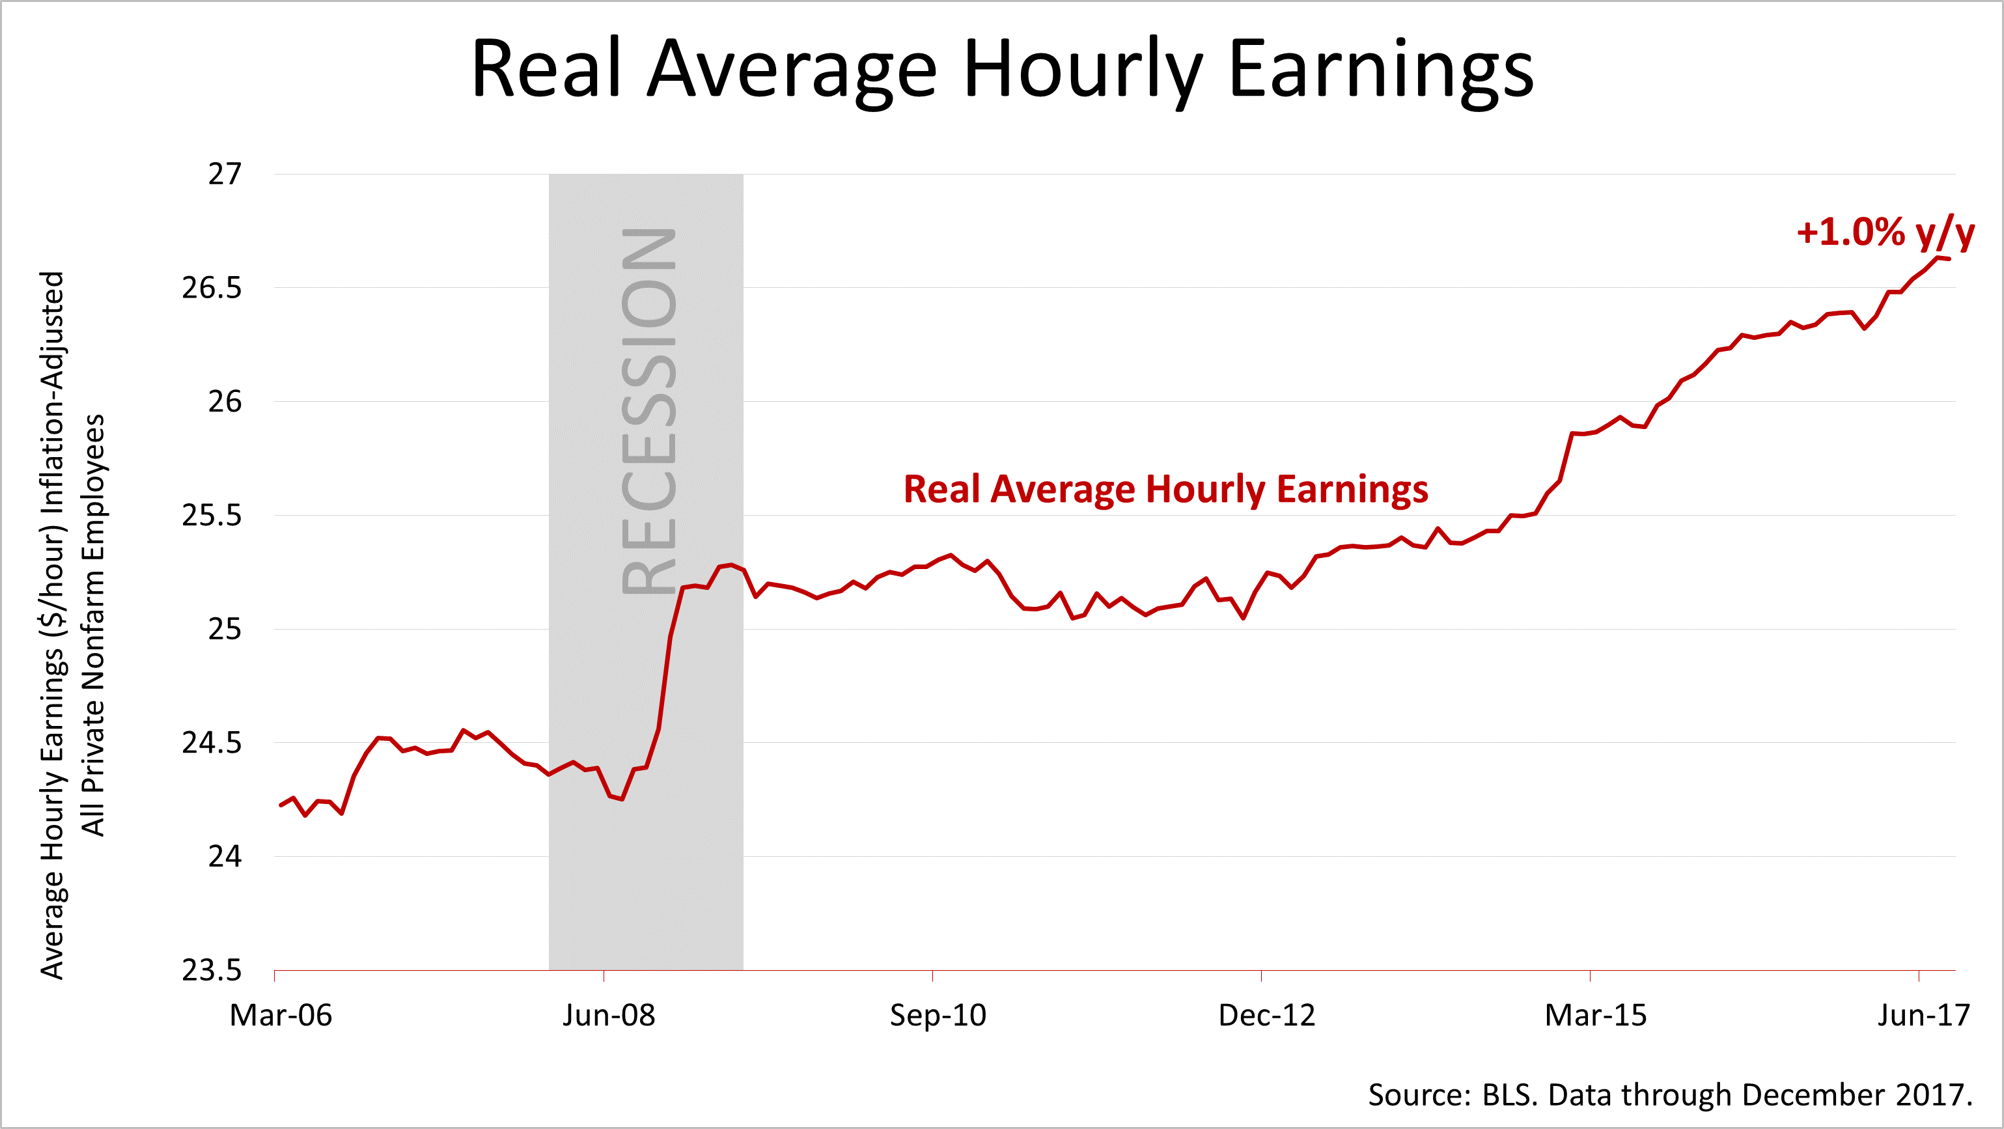
After inflation, real wages grew 1% in the 12 months of 2017. That's much higher real wage growth than was experienced in the previous three expansions. According to the Brookings Institute, real wages grew at a 0.37% annual rate in the expansion of the 1980s, a 0.71% rate in the 1990s expansion and a 0.31% rate in the expansion from 2001 to 2006.

Stocks have set records repeatedly for months and we've mentioned often in our weekly emails that a sharp drop could come at any time. The Standard & Poor's 500 index fell on Friday by 59.85 points, or 2.1%, to 2,762.13, the largest loss since September 2016. The S&P 500 has lost 3.9% since hitting a record-high one week earlier.
The chance of a bear market decline of 20% or more increases as the eight-and-a-half-year bull market grows older, and the new tax law increases the chance the Federal Reserve will make an interest-rate policy mistake by quashing growth or allowing the economy to overheat and inflation to surge. Fed mistakes caused every recession in post-World War II history.
However, earnings drive stocks and earnings expectations have been surging, bolstered by the new tax law. With real wages continuing to grow, consumers are spending and consumers account for 69% of economic growth. Despite inflation worries looming larger, there is no sign of a recession and major economic indicators are signaling strength. So, the bull market and expansion could continue for months and head much higher.
1Employment Cost Index. The BLS' ECI is built with fixed weights for individual industries and occupations.
1AHE includes 100% of non-farm private employees, and excludes benefits and employers' share of payroll taxes. 2Compound annual growth rate March 2006 through December 2008 = 3.4%; CAGR December 2008 through January 2018 = 2.0%. 2March 2006 average hourly earnings of $20.04 inflated by the personal consumption expenditures deflator (PCED).
This article was written by a veteran financial journalist based on data compiled and analyzed by independent economist, Fritz Meyer. While these are sources we believe to be reliable, the information is not intended to be used as financial advice without consulting a professional about your personal situation.
Indices are unmanaged and not available for direct investment. Investments with higher return potential carry greater risk for loss. Past performance is not an indicator of your future results.
© 2024 Advisor Products Inc. All Rights Reserved.